Abstract
With the rapid development of science and technology, the cross-convergence between various topics or fields is also increasing. Many problems may be technically difficult in the original topics or fields, but they can be easily solved after integrating knowledge of other topics or fields. Past researches has proven that there is indeed a link between different topics or fields. However, such correlations are often mutual, and there are few scholars studying the directed relationship between the topics or fields. This paper is going to find the relationship between different topics or fields based on the directed topic network. Previously, some scholars used the K-core, an algorithm for measuring the density of graphs in undirected graphs, to analyze the relevance of different academic topics/fields and visualized them. This paper will analyze academic networks based on D-cores algorithm, a variant of K-core algorithm based on directed graphs. The algorithm will divide topics or fields into four categories. In order to study the frequent patterns of topics in the entire academic network, this paper uses the gSpan algorithm to analyze the entire academic network. As a result, three more common academic topics/fields were discovered.
My model
I designed an algorithm to create a directed graph depicting different topics in the Academic Network.
The procedure of creating the model is as follows. Assume graph G = {V, E}. Then V is a collection of all topics/fields. For each author, the number of articles published in different fields is sorted. Assuming that the top three fields are the main research topics/fields, and the rest are secondary topics/fields. An edge is defined as a directed edge of from the author’s major topics/fields to his secondary topics/fields, weighted by the number of papers the author has published in the secondary field. Then, the weighted directed graph is processed by the D-core algorithm. D-core algorithm is a variation of K-core algorithm. It changes undirected network to directed network. The minimum indegree and the minimum outdegree are adjusted separately. The result is subgraphs. Considering different nodes appear in different subgraphs, the nodes can be divided into four categories: green, red, blue and black.
The picture 1 shows the network of 2012. In this picture, the distance between nodes means the relationship between them. The size of a node means the activity of this topic(the sum of indegree and outdegree).
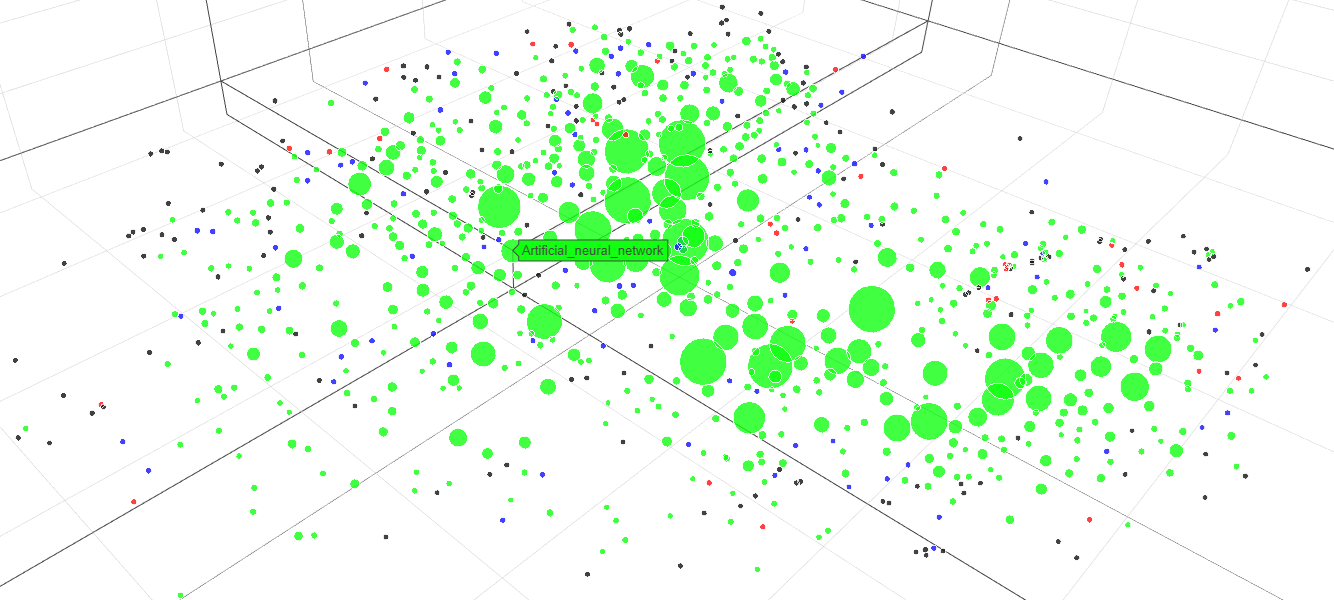
Green nodes are hot topics, because the indegree and outdegree of these nodes is very high. This means these nodes are often large, indicating that these topics/fields are developing rapidly. These fields also brought great help to other fields. For example, in the 2012 Artificial Neural Network, SVM, Machine Learning and other fields, these fields have a strong relationship with each other and developed rapidly.
Blue nodes stand for these relatively well-developed topics. They are developed, so the annual dynamics of this field are relatively small, and the sum of indegree and outdegree is relatively small, resulting in a smaller point. Taking Data Compression in 2012 as an example, in the field of information theory, data compression is already a relatively mature research topic. Only a small number of people are focusing on this topic. However, this topic is important to WiFi, Wireless Network.
Red topics have a high indegree and a low outdegree. So this field may be a good and unpopular field of development. Breakthroughs in other topics help developing these topics, such as Weather Forecasting. Such topics can be collectively referred to emerging topics.
The rest nodes are black. These nodes are often niche topics. Such topics are often difficult to define because they may be new-born topics and may develop rapidly in a few years, such as the metaverse in 2012, Or they can be the almost unpopular areas that have been developed before, such as business process management. Therefore, manual analysis is required for these points.
I used Gephi and javascript to visualize the relationship between different topics
To further study the relationship between these topics, I use gSpan algorithm to find the most frequent subgraphs in the network. To make the algorithm faster, I divide the whole picture to several small parts.
The result shows there are three most frequent modes.
-
One hot node(green node) has strong connection with several not-hot nodes(nodes which are not green).
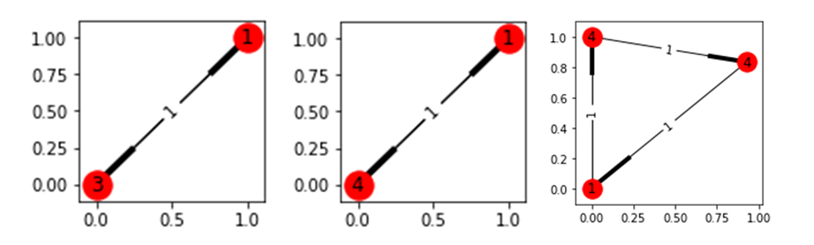
-
Several not-hot nodes(usually 4) have a relatively strong connection with each other.
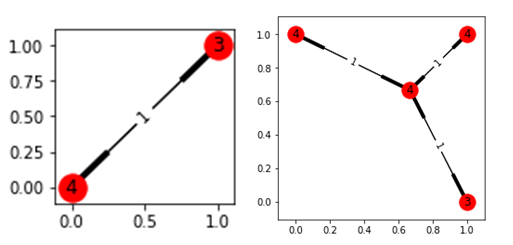
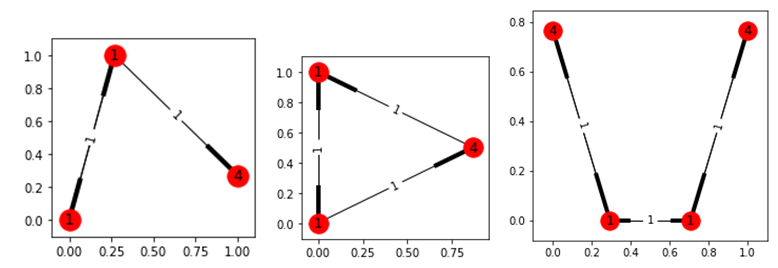
-
Two hot nodes and several not-hot nodes around them.
Conclusion
By analyzing the relationships of these topics and authors, we think:
- The combination of multiple hot topics is not as much as the frequent sub-graphs with a single hot topic as the core and two hot topics as the core. This is different from the previous expectations. The reasons may be as follows:
- across multiple There are fewer researchers on hot topics. Most of the hot topics have a huge amount of information, and it is difficult for a scholar to master several hot topics at the same time, which leads to the rare frequent subgraphs with more than three hot areas.
- even if there are researchers who span multiple hot topics, the weighting performance between the two topics will be neglected because the number is very small.
- the segmentation of the topic of the topic network caused some information loss.
-
The probability of a combination of multiple not-hot topics is high. The reason is that there are always a few not-hot topics that are relevant, such as several not-hot topics derived from the same hot field, or several well-developed areas that are gradually merging and forming new research topics. At the same time, the research level of such topics is relatively complete, and it is easier for scholars to master multiple topics at the same time. This also shows that there is a greater possibility of strong links between these not-hot topics.
-
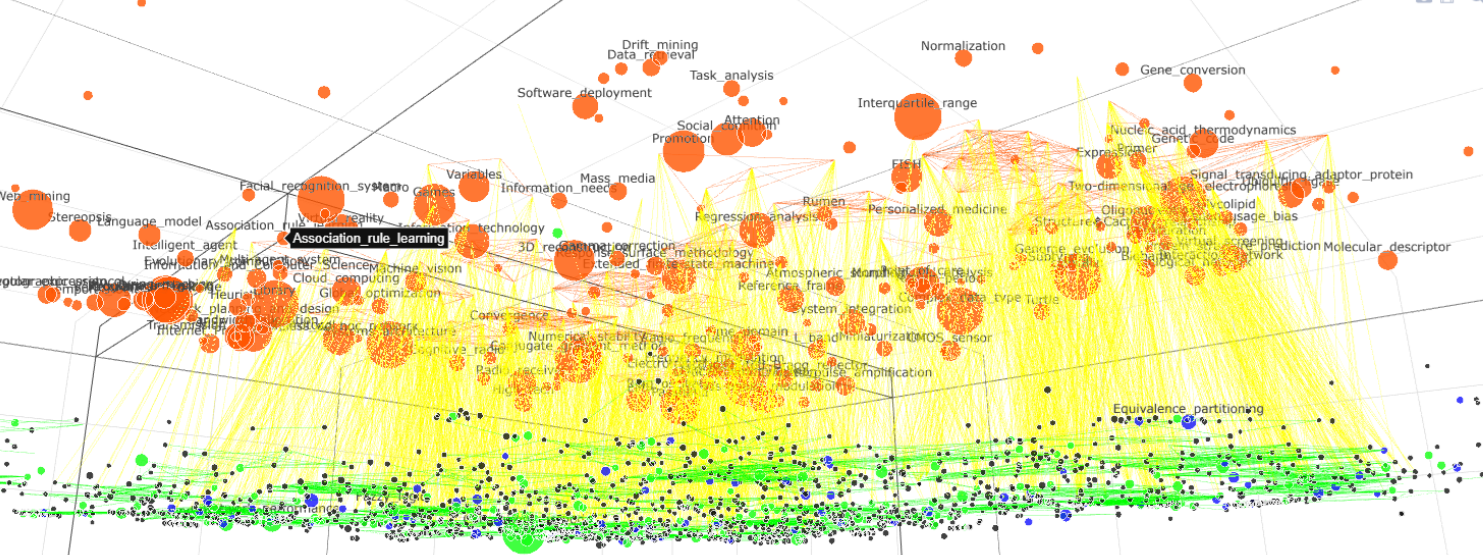
In order to better demonstrate the research, we visualize the findings of this paper, as shown below. This picture shows the relationship between the topics of 2012. Among them, the orange points are hot topics(green ones in the previous picture), the green points are new-born topics(red ones in the previous picture), the blue points are mature topics, the black points are isolated topics, the hot topic is on the same plane, and the not-hot topic is on the same plane. The size of the node is similar to the previous picture, indicating the popularity of the topic. In addition to the relationship between different topics, the size of points also includes the development of the same topic in the previous year and next year. In order to show the relationship between the topics, we divide it into small pieces. The red side of the figure shows the relationship between two hot topics, the yellow side indicates the relationship between hot topics and not-hot topics, and the green side indicates the relationship between not-hot topics. From the figure we can see that the red edges of each part are sparse, while the yellow edges of the corresponding areas are denser, while the green edges are very dense. This confirms that the relationship among hot topics is relatively weak, but the relationship with not-hot topics is strong. The relationship between not-hot topics is far stronger than the strength of the relationship between hot topics. We analyze the network constructed by only the unpopular topics (that is, the network constructed by the green node and the green edge), and find that the number of edges whose starting point or ending point is a mature topic occupies 47.42% of the total number of edges.
- Although the current discipline integration is a trend, at least there is little topic integration in the CS field. Most of the CS field is a hot field but most hot topics will not have a strong connection with other hot topics. This is because they are not developed topics. However, in the future, when many topics are developed, there will be a discipline fusion in CS.